Category Archives: Science

Finding Ham, Shem, and Japheth via Y-Chromosome DNA

At Genesis and Genetics, we have examined Y-chromosome genomes searching for Noah and his three sons, Ham, Japheth, and Shem. They were easy to find.  According to our analysis, if you have the rs17306671 Y-chromosome mutation nucleotide A you are from Shem. If you have the rs9786139 Y-chromosome mutation nucleotide A you are from Ham. If you have the rs3900 Y-chromosome mutation nucleotide G you are from Japheth. If you are a woman, you will have to check your father’s y-chromosome since women don’t have the y-chromosome.

The following presents the easy-to-follow logic and analysis which anyone can repeat. Our findings are consistent with the Bible and modern science raw data.

Here is a bit of background: Y-chromosome DNA is exclusively found in males; it is inherited from one’s father. The Y-chromosome has approximately 60 million base pairs, each of which is subject to mutations. Mutations develop in the Y-chromosome, typically at the rate of 2 mutations per generation. This is based on a mutation rate of 1.0*10^-9 mutations /nucleotide/year (Reference 1) and 30 years per generation. These mutations allow us to track ancestry. If one man populated all the earth, all males would have his Y-chromosome, and if this man had two sons, one would expect that roughly half of the world would have one son’s mutations and the other half would have the other son’s mutations. Furthermore, if our original ancestor had 10 grandsons, one would expect that each grandson would have mutations that would each exist in approximately 10 percent of the male population. Successive generations would continue to generate new mutations that would form a human family tree, known as a phylogenetic tree to geneticists.

In our research, we used the above principles in tracking our most ancient ancestors. We made no assumptions and shelved our preconceived ideas. We wanted to see where the data led us. Appendix A shows the precise method we used to extract the data. Our strategy was simple; we gathered the Y-chromosome mutations, which are seen in more than 5 percent of human males, and entered them into a spreadsheet. We looked for patterns and color-coded the resulting groups. Please consider doing one Y-chromosome example yourself using Appendix A as a guide, or if you have your Y-chromosome data, you can trace it back to your most ancient ancestor/ancestors. You will see the ancient ancestor to whom you are related.

The data used in this research came from the 1000 genomes project (Reference 2) and retrieved using the Ensembl browser (Reference 3). The data appeared to be correct with no errors. No data was eliminated due to suspect errors, and no data was “cherry-picked” to suit any preconceived ideas. Our thanks to the great effort of those who did the sequencing and publishing of the raw data. We also greatly appreciate that it was made available to the public.

We started by taking 57 Y-genomes of diverse people (Americas, East Asia, Europe, South Asia, and Africa). Next, we gathered mutations that were in at least 5 percent of the world’s male population. The technical term for this is those with a Mean Allele Frequency (MAF) greater than or equal to 0.05 (5 percent). These mutations are the most interesting; any smaller MAF mutation is a subset of those greater than 5%.

The spreadsheet below provides 57 rows (individual male humans) and 30 columns (mutations over 5 percent of the population). Each column element of the matrix was color-coded to show us whether the individual had the mutation or not. We noticed patterns beginning to form (you can CLICK HERE to see the EXCEL copy.)

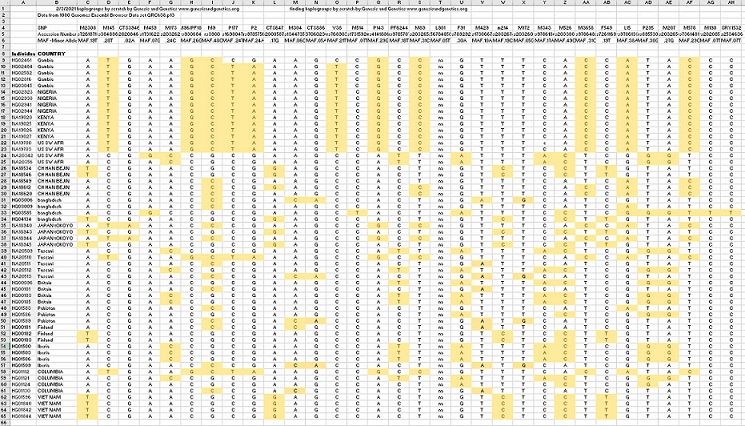
Next, we switched columns and rows to form groups. The groups were obvious. We also took each group and moved the columns so that the columns for each group with the largest MAF were on the left. Now we can see a clear pattern in the figure below. We see that each individual fits into just one group and had no mutations in any other group. Also, we see that every individual in the group has the mutation with the greatest MAF; this is the mutation of the most ancient ancestor of that group. Here is what the spreadsheet looks like after grouping: Note: you can CLICK HERE to see the matrix in EXCEL.

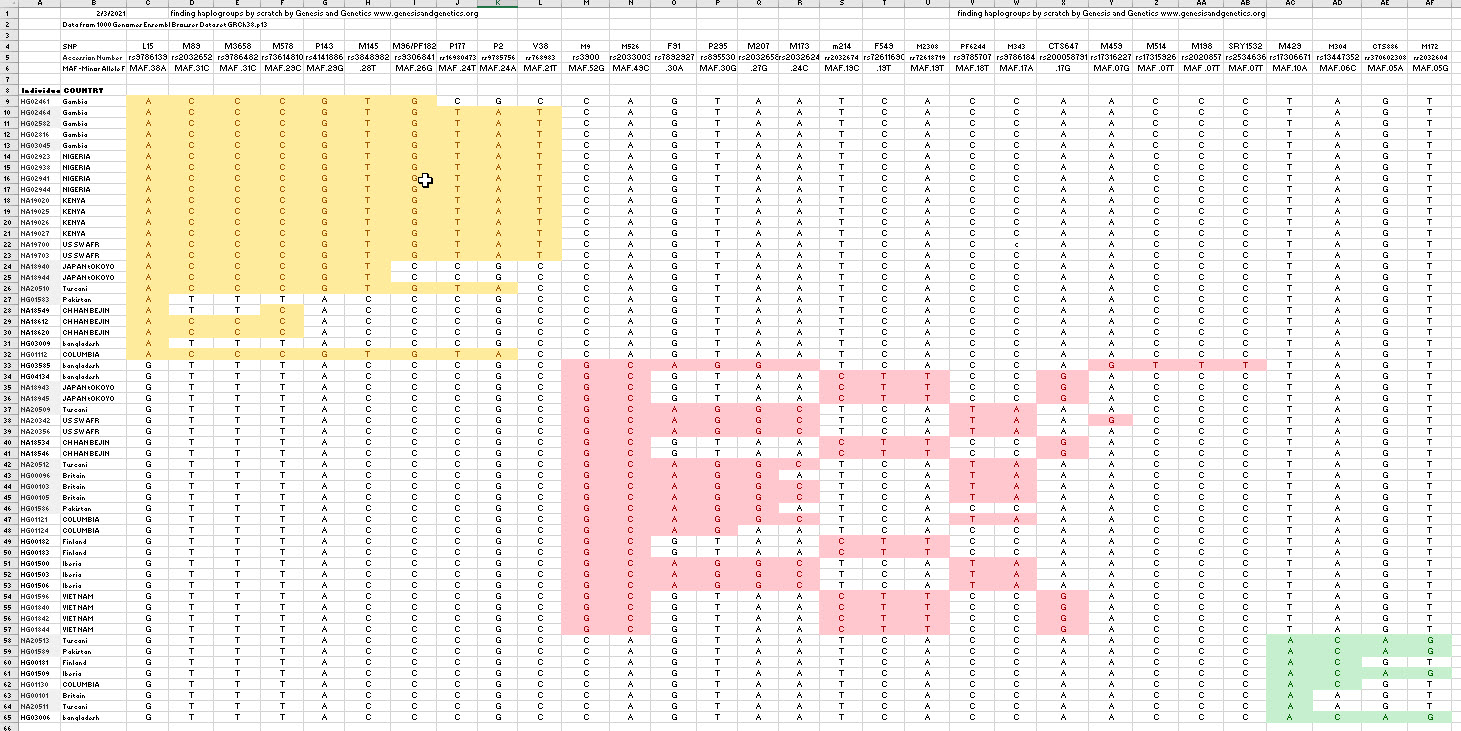
Looking at the matrix above, we see that each group has one maximum MAF. The yellow is .38, the red is 52, and the green is .10. They add up to 100 percent.

Now that we have shown that our most ancient ancestor had three sons, we can state that this finding is consistent with the Bible. The three groups are consistent with the three sons of Noah: Ham, Shem, and Japheth. The Bible states that, generally, those from Ham went south to Africa and southern Asia, those from Japheth went north to northern Europe and northern Asia, and those from Shem stayed in the Caucuses, the Near East, and North Africa. Therefore, one could easily conclude that Ham is the yellow group, Shem is the green group, and Japheth is the red group. Note: Noah’s Y-chromosome is also known since it would be that of the three sons with all mutations removed.

Bible in Genesis 10, the Table of Nations, states that all humanity came from these three sons:

Genesis 10:1  Now these are the generations of the sons of Noah, Shem, Ham, and Japheth: and unto them were sons born after the flood.

Genesis 10:32  These are the families of the sons of Noah, after their generations, in their nations: and by these were the nations divided in the earth after the flood.


This means that roughly 1/3 of the earth’s male population came from each son, but, since Japheth had 7 sons, Ham had 4 sons, and Shem had 5 sons; therefore, the worldwide distribution should be closer to the following:

Patriarch   Number of sons    % Projected World Population        Observation

Japheth        7 sons                                              43.75                                         52

Ham                4 sons                                              25                                                38

Shem              5 sons                                              31.25                                         10


The chart above shows that both the Ham and Japheth results were higher than expected, and Shem was lower than expected. However, this can be explained in at least two ways:

(1) The Ham and Japheth offspring are in the world’s heavily populated areas, namely South and East Asia.

(2) The Thousand Genomes Project did not provide representatives of the Near East, the Mid-East, or Northern Africa, all of which would increase the Shem percentage, thereby decreasing Ham and Japheth’s percentages.

The above two issues are not meant as criticism but offered as an explanation.

Our findings are consistent with the Bible, secular ancient history, and genetic diversity:

  1. The Bible documents Noah and his family to be the only ones spared from the deluge which flooded the entire earth, and the earth was repopulated through Noah’s three sons.
  2. The historical period began when the Sumerians began writing cuneiform tablets. These early writings documented the kings before and after the flood. Also, the Sumerian legends are consistent with the world being populated by the three sons on the Ark.
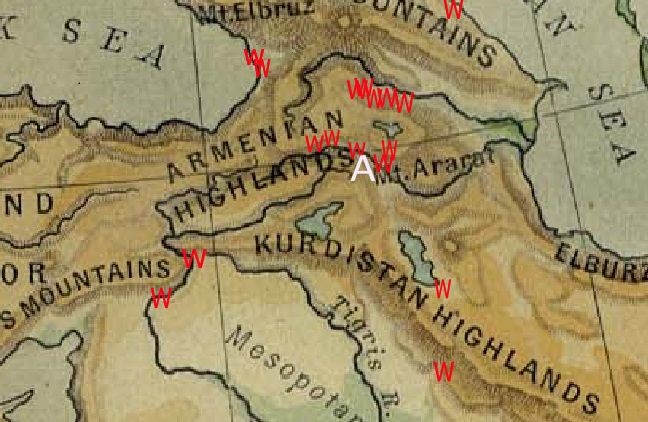
  3. According to the Bible and Sumerian history, all humanity came from one family. As they migrated throughout the world, the genetic diversity would be lost from those who separated from the core population; therefore, the most genetic diversity should be where Noah’s family settled, the Near East. Those who migrated to the Americas, Australia, and southern Africa lost some genetic diversity. We can consider two levels of observing genetic diversity, first, what we see and, second, what DNA tells us. We can easily see eye color, skin color, and hair color. Looking at a globe, it is apparent that those with the most visual diversity meet in the Near East, the place of disembarkation from Noah’s Ark. From a DNA standpoint, one can look at the diversity of haplogroups, both Y-chromosomal and mitochondrial. The extremities are South Africa, Australia, and the Americas, which have only a few haplogroups. The location with the most haplogroups is, again, in the Near East.

To summarize our findings:

(1) From a Y-chromosome perspective, it appears that all humanity came from three male humans.

(2) Item (1) is not proof of the Biblical narrative concerning Noah’s three sons, but it is consistent with it. To prove it, one would have to sequence every human male ever born and analyze his genome. If anyone can trace an individual human Y Chromosome back to some basal mutation other than the three given, please let us know and comment below.

(3) We can now project Noah’s DNA; it is that of his three sons with no mutations.

(4) Our findings are consistent with the Bible, Sumerian history, and our current state of human diversity.

Future analysis It is now possible to know the Y-chromosome DNA of each of Noah’s grandchildren. This is in our job jar.

References:

1 https://www.ncbi.nlm.nih.gov/pmc/articles/PMC2748900/#:~:text=The%20chromosomes%20were%20separated%20by,7.0%20%C3%97%2010%E2%88%928).

2 https://www.internationalgenome.org/

3 https://useast.ensembl.org/index.html

Appendix A

If you would like to repeat this analysis or add to it, the following is the step-by-step procedure we used.

Let’s start by taking someone from, perhaps, Peru and find out to which group he belongs. Did he come from Shem, Ham, or Japheth?

(1) We open Ensembl (https://useast.ensembl.org/index.html ). Leave everything default and enter rs9786139 in the upper right-hand box—hit enter.

(2) You should get a new window with the following “rs9786139 (Human Variant).” Click on it. Notice that the MAF is .38.

(3) Click on the ICON that says, “population genetics.” Scroll down to find “AMR” and the subgroup “PEL.” Click on the “PEL.” You can see that 95 percent of this group has a “G,” and 5 percent of the population have an “A.” Next, go to the far right of the “PEL” row and click on “show.” Each of the rows of this screen is an actual human being. You will notice that most of this group has a “G,” but a few have an “A.”

(4) Looking at the population genetics of those from PEL, Peru, you can see that a few Peruvians are from Ham, but most are from someone else. You can find out who by entering the defining mutations for Shem and Japheth. If you enter all the mutations and analyze the same Peruvian, you will see all his mutations are in one group or another. If you look at rs3900, you will see that most Peruvians are from Japheth.

(5) continue entering the mutations one by one, and you will see that our Peruvian is only from one group and has no mutations from any other group. If you do a significant number of individuals, please sent them to us.


Print Friendly, PDF & Email

How to Build and Rebuild the Human Heart By Automatic Self-Assembly

More people die from heart disease in the USA than any other illness. However, researchers are saying that they have hopes of rebuilding defective human hearts.

The Texas Heart Institute in Houston is conducting some fascinating research. The end goal is to develop a method of rebuilding defective human hearts and supplying them to those in need of heart transplants. The researchers obtained a defective human heart and removed all the cells except what is called the extracellular matrix, the outer framework. Therefore, all the veins, arteries, valves, and the electrical grid were removed. It looked like a heart but was nonfunctional. Then, they poured stem cells into the voided heart membrane. The stem cells transformed into the various cells needed to rebuild the heart, and each cell went to its proper place. All cells were working in unison to form the required heart components. The heart looked to be complete and viable. Next, the researchers filled the veins and arteries with fluid, and, to everyone’s amazement, the heart STARTED BEATING AND PUMPING! WOW! The heart automatically rebuilt itself from stem cells!

The research, as mentioned above, is terrific news for those needing heart transplants and good news for those, like the present writer, who are investigating epigenetics and origin of life. The fact that the stem cells can transform and somehow assemble heart components makes one wonder: What mechanism and what intelligence makes this possible. It appears to be automatic self-assembly, but automatic self-assembly defies all logic and scientific principles.

A few years ago, I bought a crib. The packaged kit had all the parts and instructions. It also had a good picture of the finished crib. There were probably 30 pieces, including the fasteners. It took one evening to assemble it, and when done, it was apparent that I had reversed the back and front. Wouldn’t it have been nice if I could have put the crib parts on the floor and watched them self-assemble? Imagine the difficulty in assembling the human body with 37 trillion cells, each cell containing trillions of pieces. Biological automatic self-assembly is indeed a task of Biblical proportions and requires divine intelligence.

Think about how a heart develops in a baby. At conception, the ovum joins with the sperm and becomes a complete DNA package known as an egg. The egg is a single cell, a master stem cell, and it divides over and over until it becomes a mass of stem cells. The photo on the right shows a few stem cells on a pinpoint. This is what you looked like shortly after conception. These stem cells have a built-in mechanism designed for automatic self-assembly. Fourteen days after conception, the heart begins to form. Each stem cell assigned to the heart transforms itself into a heart cell. Then, the automatic self-assembly of the heart starts and takes three days to complete. Next, the fully functional heart begins to beat and pump blood. We must not forget that timing is critical; when the heart starts beating, it must have blood to pump and have a place to pump it. It appears that automatic self-assembly is responsible for both building and rebuilding the human heart.

The researchers at the Texas Heart Institute concluded that the stem cells take their cues from the extracellular matrix. It seems to be the only possibility. But how does it work? The stem cells have no arms, legs, fingers, or brains! When confused, we can look to the Bible:

John 1:1  In the beginning was the Word, and the Word was with God, and the Word was God. 

John 1:2  The same was in the beginning with God. 

John 1:3  All things were made by him; and without him was not any thing made that was made. (KJV)

The Bible states that the Word of God created all things, which would include an automatic-self-assembly mechanism. God’s Word permeates all things throughout the universe. In short, the Creator’s intelligence is embodied in everything: every star, every atom, every molecule, every cell, every photon, and every heart; it is omnipresent. God’s Word is not only omnipresent, but it is also omniscient. It tells the stem cell what to become, where to go, and how to self-assemble. Additionally, God’s Word is omnipotent and provides the energy and labor to accomplish that which He wants to accomplish, including automatic biological self-assembly. The details of this divine mechanism are yet to be understood, but other explanations are absent.

God’s Word is embedded in the extracellular heart matrix and everything else in the creation. His Word is everywhere and accomplishes that which He wills: Here, we see the Lord speaking through His prophet, Isaiah:

Isaiah 55:11  So shall my word be that goeth forth out of my mouth: it shall not return unto me void, but it shall accomplish that which I please, and it shall prosper in the thing whereto I sent it. 

Automatic self-assembly is not unique to human hearts; it is the method whereby all life grows and matures: every human, every mammal, every reptile, every bird, every plant, every bacterium, every fungus, and every insect. Automatic self-assembly happens routinely everyday trillions of times. David wrote a psalm showing he understood:

Psalm 139:14  I will praise thee; for I am fearfully and wonderfully made: marvellous are thy works; and that my soul knoweth right well.

Note: The scientific term for automatic self-assembly of the heart or any organ is “organogenesis,” and the general term for automatic biological self-assembly is morphogenetics. They are both poorly understood by the scientific community. Furthermore, it poses a problem for those who embrace evolutionary theory in that automatic self-assembly would have to be in place before the first cell divided.

Print Friendly, PDF & Email

Noah’s Wine Country, the origin of Human and Wine Migration

Some believe that the Biblical account of Noah is a myth; some say it is an allegory; and some, like the present writer, say it is a true historical account. So far, we have not found Noah’s colossal Ark; maybe it was recycled by our ancient ancestors, covered by an ice cap, or buried by the Mount Ararat volcano; nonetheless, the search for Noah’s Ark continues. Meanwhile, we, at Genesis and Genetics, are looking for evidence of Noah in other places, one of which is searching for Noah’s vineyard. So, let’s combine our knowledge of the Bible with modern science and search for Noah’s vineyard.

The Bible says that after leaving the Ark:

Genesis 9:20 Noah began to be an husbandman, and he planted a vineyard … (KJV)

Noah planted a vineyard; but, by now, surely all signs of Noah’s vineyard have disappeared. Right? It appears that is not the case; ancient grape seeds (pips) have been found near Mount Ararat. These grape pips have been carbon dated and genetically sequenced. As a result, their DNA has been traced to modern grapes. These results are illuminating, but before we get into the migration of grapes, let’s get a bit more background from the Bible concerning Noah and his Ark:

Genesis 8:4  And the ark rested in the seventh month, on the seventeenth day of the month, upon the mountains of Ararat (KJV).

The Hebrew word “Ararat” is the word for “Armenia.” When Noah’s Ark settled in the mountains of Armenia, the Armenian borders had yet to be defined; however, the Bible is a timeless book and we can assume ancient Armenia included present-day Armenia. Also, going back in history to just after the time of Moses, we find that ancient Armenia included modern-day Armenia, Eastern Turkey, Azerbaijan, and Southern Georgia. Therefore, logically, Noah’s vineyard should be in one of these countries. The Bible states that the Ark settled in the mountains of Armenia; so, it could have landed on Mount Ararat or any of the Armenian mountains. Christian tradition gives Mount Ararat the honor of being the place of disembarkation from the Ark, and it is, for sure, a possibility.

We find that the modern countries representing ancient Armenia are, indeed, rich in wine history. Here are some facts:

  • Georgia is touted by many as being the birthplace of wine. It claims to have been making wine for 8000 years. In the days of the Soviet Union, Georgia was known as the Soviet Union’s wine cellar.
  • Azerbaijan also touts its ancient winemaking. Azerbaijan has much diversity in landscape, some of which are perfect for growing grapes.
  • Present-day Armenia has a long history of wine culture. Many modern-day Armenians consider wine as the national drink. In Armenia, there are legends that Noah planted his vineyard in the Ararat Valley (Figure 1).


      Figure 1 Mount Ararat with vineyards in the foreground


Armenia boasts of having the world’s oldest winemaking facility located in Areni Cave (Figure 2).

Figure 2 Excavations in Areni cave

In addition, Armenia is rich in ancient history. For example, Carahunge, Armenia is a Stonehenge-like site. Many of the stones have holes drilled in them, and they are called speaking stones in that they make noise as the wind flows through them. The Carahunge formation of stones predates the British Stonehenge by approximately 4000 years, dating it to approximately the same age as the most ancient Armenian vineyards.

Figure 3 Carahunge, the Armenian Stonehenge predating the British Stonehenge by nearly 4000 years.


DNA sequencing shows that most Domestic wines owe their origins to wild grapes in the Near East.

Since the discovery of DNA, many mysteries are being solved in various fields including horticulture. Worldwide, one of the most valuable horticultural crops is grapes; therefore, scientists give much attention to viticulture. DNA markers (SNPS) are used to connect domestic grapes to wild species and trace their migration from country to country. According to an article in PNAS (proceeding from the National Academy of Science), grape domestication began 6,000 to 8,000 years ago with the wild grape Vitis vinifera sp. Sylvestris. This grape is common in the Northern hemisphere, but they have traced domestic grapes to the DNA most closely aligned with those wild grapes from the Near East, specifically Armenia, Georgia, and Azerbaijan (reference 1). Therefore, the origin of domestic grapes is coincident with Noah’s wine country in ancient Armenia. This, of course, does not prove the Biblical account of Noah, but it shows the scientific evidence is consistent with the Biblical narrative.

Carbon Dates

We at Genesis and Genetics consider carbon dating good science in principle; however, we have concluded that the calibration curves, based on the uniformitarian model are not correct, and carbon 14 values must be corrected for the Biblical flood effects (Reference 2, To access our carbon 14 date calculator click here). The oldest evidence of winemaking dates to 5900 B.C. Correcting 5900 B.C. for flood effects gives us 2141 B.C. Since the flood receded approximately 2348 B.C., the oldest grape pips found so far lived 200 years after disembarkation from the Ark. Therefore, the oldest vineyard found thus far is probably not Noah’s original vineyard, but they are vineyards planted by Noah’s near kin. If some ancient grapes are carbon dated closer to the flood date of 2348 B.C., it may very well be the vineyard planted by Noah.

Figure 4 shows some of the ancient Armenian vineyards found so far. They probably are those of Noah’s offspring and show the earliest stages of human migration. The present findings are good corroboration of the Biblical narrative and show that (1) Noah’s Ark settled in what is now known to be wine country, (2) there is evidence of ancient winemaking where Noah landed, and (3) that ancient Armenia is the origin of modern domestic grapes.

Figure 4 Some of the Ancient Armenia vineyards found so far (the red W’s denote ancient vineyards and the white A shows the location of Mount Ararat

Summary
 

The Biblical narrative and archaeological evidence meet in ancient Armenia. Now it is clear that Noah and his offspring planted vineyards in some of the best wine-producing country in the world. Also, Noah’s wine country has been shown to be the origin of modern domestic grapes. Our findings are not proof of Noah’s account but show clearly that the Bible is once again consistent with scientific evidence. So, next time you enjoy a glass of wine, grape juice of a handful of raisins, consider giving Noah a little credit for his husbandry skills and give him a bravo for saving humanity from annihilation.


Coming Soon

Soon we will release a blog concerning the migration out of Noah’s vineyard. We have found that only a portion of Noah’s family “came from the East” and settled in the Land of Shinar (Mesopotamia). We will also identify the historical Nimrod.

References:

  1. https://www.pnas.org/content/108/9/3530?ijkey=487feaf2bb16b6c3b0eafa120da366ea9d45a464&keytype2=tf_ipsecsha
  2. http://www.genesisandgenetics.org/2019/07/27/flood-effects-on-radio- carbon-dating/


Print Friendly, PDF & Email

The Bible and Radio-carbon Dating

Neanderthals have been carbon-dated to 30,000+ years before present; extinct dire wolves have been dated to 10,000+ years before present, and coal has been dated to 20,000+ years before present. However, the Bible proclaims a young earth, approximately 6,000 years old. How can these differences be rectified? We, at Genesis and Genetics, have concluded that the carbon levels are generally correct, but the calibration is wrong. Secular science assumes no significant catastrophes such as Noah’s flood; however, if we consider the flood, we find that:

Noah’s flood significantly influences radiocarbon dating.

This paper offers the following radio-carbon conversion chart, which can be used to convert secular science carbon dates to Biblical dates. This chart assumes that (1) the Bible dates are correct, and (2) a global catastrophic flood did happen, and (3) the secular radio-carbon values are correct. The following chart may be used to convert any secular science radiocarbon date to a Biblical date, or you can CLICK HERE to go to our Radiocarbon Biblical Date Calculator.

Figure 1 requires the following points of explanation:

1. All dates more recent than approximately 1,000 B.C. are the same for the secular and Biblical calibrations.
2. There is a human-made spike, the atomic bomb testing of the 1940s and 1950s. They are similar in form, and both had significant effects on Carbon 14 amounts.
3. The amount of Carbon 14/12 ratio before the flood was constant and decayed according to its half-life.
4. The Flood suddenly reduced Carbon 14/12 which explains how secular carbon dating is so different than Biblical. The year of the flood, 2348 B.C., renders vastly different fossil dates depending on the exact time of death of the creature being dated.
5. For some secular dates, there can be several Biblical dates. For instance, consider 10,000 B.C., the Biblical calculator gives three possibilities: 3398 B.C., 2348 B.C., and 2250 B.C. The 3398 B.C. date would be someone who died before the flood and had his grave washed to a place where anthropologists could find it. The 2348 B.C. date would be someone who died in the flood, not at the onslaught, but several weeks or months later. They would have lived on one of the massive rafts of debris or in a boat other than the Ark. The 2250 B.C. date would apply to one who died 98 years after the flood.\
6. The period between the flood and 1,000 B.C. was the flood-recovery period, which was also the ice age.

Background

God told Noah that He would destroy the earth with a flood (Genesis 6:13). The flood was a catastrophe of Biblical proportions. The land surface was washed, damaged, and resurfaced as the rains came down. The atmosphere was washed clean by the torrents of rain. The oceans were stirred as the fountains of the deep opened and accompanied by earthquakes and volcanoes. All these happenings changed the carbon quantities of the atmosphere, the land, and the sea.

The basis for Conversion Chart

Radiocarbon dating is a function of the ratio of the amount of carbon-14 divided by the amount of carbon-12. Figure 2 provides a time history estimate of carbon 14/12 levels in our atmosphere. This estimate is based on the assumptions that the carbon 14/12 levels were constant before the flood, dipped to very low levels during the flood, and recovered to the levels we have now. The highlighted numbers in Figure 2 correspond to the explanatory notes.


Additional Supporting Evidence for the Above

Atmospheric carbon values can change quickly.

Our world is continually balancing the amounts of carbon in the atmosphere, the oceans, and the soil, and this balance does not discriminate between carbon-12 and carbon-14, they mix homogeneously. Fortunately, we have data regarding sudden changes in carbon-14 levels and the atmosphere’s response to these sudden changes. There was a sudden injection of carbon 14 in the 1950s and 1960s during the atomic bomb tests, and these tests can help us understand the effects of sudden changes to carbon 14/12 levels. The nuclear testing caused the carbon 14 values to skyrocket in the atmosphere while the carbon 12 remained the same; carbon-14 levels doubled from the pre-atomic-testing values (Reference 1). Carbon 14 has a half-life of 5730 years and had it not been for the dry land and the oceans, it would have taken 10s of thousands of years to recover to the pre-atomic-testing levels, but, surprisingly, it recovered quickly, in just a few decades. Equilibrium was reached quickly due to the carbon-14 absorption in the land and sea. This atomic testing carbon-14 “spike” is depicted in Figures 1 and 2. This is a human-made spike, but the God-made “spike” can also be seen in both figures.

The deep oceans are deficient in carbon-14

Another point of evidence is that even today there are vast differences in the amount of carbon 14 in the various depths of water; for instance, right now, some of the deep ocean has water that carbon dates to 2400 years before present, and the average deep ocean water dates to 1400 years before present (Reference 2). Therefore, it is easy to conclude that the pre-flood deep oceans contained almost no carbon-14. Plus, this deep ocean water would mix with the “fountains of the deep” water which would contain no carbon-14 but much carbon-12.

The carbon-12 released by the earthquakes and volcanoes reduced the carbon-14/carbon-12 ratio.

Since carbon dating uses the ratio of carbon-14 to carbon-12, the additional amount of carbon-12 would make the ratio smaller, which would also result in dates older than the true dates. Presently our atmosphere contains approximately 800 gigatons of carbon. This carbon comes from volcanoes and photosynthesis of plants. Currently, we are having volcanoes that occasionally erupt, but also emit small amounts of carbon while dormant, but during Noah’s flood, there would be massive eruptions and fissures spewing large amounts of carbon. This carbon would be pure and carbon-14 free.

Nearly 100 percent of the carbon in our body is replaced annually. (Reference 3)

The Biblical narrative implies that many creatures did not die at the flood onset. It appears that there were huge rafts of debris, possibly hundreds of miles in breadth and thousands of feet in depth. Therefore, creatures, including humans, could have survived for weeks or even months on these rafts of debris. The longer a human, animal, or plant survived would significantly affect their amount of carbon-14/12. Much radiocarbon testing uses collagen, which is replaced in the body rapidly.

The atmosphere was different before the flood.

We know that before the flood, there were giant insects such as dragonflies and cockroaches. These enormous insects and others have been documented in the fossil record (Reference 4). Secular science had concluded that these giant insects could only have lived at a time when the oxygen levels in the atmosphere were 30 to 50 percent higher than what we currently have. This ancient atmosphere would, most probably, have reduced the production of carbon-14 simply because there would be less nitrogen available to convert to carbon-14.

Summary

In summary, the global flood has a significant effect on carbon dating. The fountains of the deep opened, spewing out carbon-14-free water; the surface of the earth was covered with carbon-14-free silt; the massive volcanic eruptions flooded the atmosphere with carbon-12, and the carbon-14/carbon-12 ratio was reduced close to zero. Since carbon is replaced quickly in the body of living creatures, the exact time and circumstance of death affect the carbon dating results.

Takeaways from conversion chart

Here are some exciting takeaways we can collect from this chart in figure 1:

1. The “flood spike” of carbon 14/12 explains why secular scientists have concluded everything is older than the Biblical dates.

2. The Bible implies that all the creatures did not die until just a few months before the landing of the Ark; therefore, the carbon 14/12 ratio was changing rapidly in all living beings during this period. The resulting dates could vary by thousands of years. Looking at the chart in Figure 1, we can see a vertical line at the year 2348. During this single year, many humans, plants, and animals died. Some during the initial onslaught and some during the ten months or so while on rafts or boats. Each casualty reflected the carbon ratio at that time. Their bodies were rapidly replacing low carbon14 from the atmosphere and the food chain.

3. Any radiocarbon date more recent than 1000 B.C. is generally accurate whether the secular or Biblical flood calibrations are used.

4. The chart shows two spikes, one from the atomic bombs and one from the flood. Both spikes are abrupt and recover rapidly.

5. Example: Otzi, the Iceman has been dated to 5,300 years before present. Using the conversion curve, this would convert to 1900 B.C., which would mean that Otzi and Abraham were contemporaries. Otzi’s DNA clearly places him in the category of modern man.

6. Neanderthal fossils carbon-date to over 28,000 years or more. Converting the Neanderthal carbon dates to Biblical dates we can see that they all died in the flood.

References:

1.http://web.science.uu.nl/AMS/Radiocarbon.htm

2 https://agupubs.onlinelibrary.wiley.com/doi/full/10.1029/2007JC004095

3.https://www.reddit.com/r/askscience/comments/g63l6/are_98_of_the_atoms_in_the_human_body_replaced/

4.https://news.nationalgeographic.com/news/2011/08/110808-ancient-insects-bugs-giants-oxygen-animals-science/

Print Friendly, PDF & Email

Which Came First – the Chicken or the Egg? The Bible and Science

This has been a topic of debate for more than 2000 years, but with the latest finding in genetics, it appears those who say the “chicken” are on the winning side. The present writer says the “chicken” based solely on the Biblical narrative, but I am pleased to pass on the recent scientific findings that support the Biblical stance.

We can start by summarizing what we know about chickens, eggs, and genetics:

  • Chickens and their eggs have the same DNA. A chicken’s DNA is set at conception and remains the same no matter the form: egg, chick, pullet, capon, hen or rooster.
  • Chickens are domestic animals whose purpose is laying eggs. Some lay up to 300 eggs per year.
  • Chickens have a gene which allows them to produce an egg with a shell in less than 24 hours. This gene is unique to chickens. No other egg-laying creature has it.
  • Chickens are a unique species: Gallus gallus. There are many colors, shapes, and sizes, but only one species.

Previously, those who accepted evolutionary biology said that the egg came first. This was based on the notion that a near chicken mated with another near chicken and produced a chicken egg. This chicken egg hatched and found another chicken that was conceived by two near chickens. The two chickens mated and Gallus gallus made its debut as a viable species. Case closed! Well, not quite! say some of their peers. Recent genetic studies found that chickens have a unique gene called ovocledidin-17 (Oc17) 1. Without the proteins produced by this gene, a chicken cannot lay an egg. This causes trouble with the “egg first” thinking since near chickens could not lay a chicken egg because they didn’t have the Oc17 gene. So, if the egg couldn’t come first, it had to be the chicken. It would be impossible for an egg from two near chickens to develop a complex gene which produces a protein with 142 amino acids. You would need two eggs that could accomplish this feat and coexist at the same time and place. This defies any imagination of probability and is a severe problem for those putting their money on the egg. The ancient philosopher, whoever he or she was, couldn’t have picked a worse example for the evolutionists. He or she could have picked any other egg-laying creature and would have avoided this inconvenient truth. On the other hand, for we creationists, the Bible is once again shown to be Rock solid.

It must be said that the evolutionary stance is still not dead. The chicken is said to be the closest living relative to the T-rex (Tyrannosaurus rex). Since we do know whether T-Rex had the Oc17 gene, the case is not closed.

Now, let’s look at the Biblical narrative. The Bible says that all things were created in six days, this includes the wild and domestic birds. The Bible also states that all things were created after their kind and that they reproduce after their kinds. Therefore, the Bible, which does not change with the ages or “latest” hypotheses is and has always been clear:

  • Gallus gallus was created during the first six days of the creation. It was a chicken and it mated with other chickens that were also created during the creation week.
  • Gallus gallus reproduces after its kind and produces more chickens.
  • The chicken was created for man. It has the ovocledidin-17 protein which separates them from other species and allows us to raise chickens and have plenty of fresh eggs.
  • Also, the Gallus gallus species has sufficient genetic diversity to produce egg laying chickens and meat chickens. Some chickens lay beautifully colored eggs and some chickens have silky feathers. They were divinely created for us. They are like dogs, they come in all shapes, sizes, and colors to be useful and pleasing to mankind.

Dear friends and children, the Bible gets it right every time. It is Rock solid and can be trusted, eternally.


References:

  1. https://www.ncbi.nlm.nih.gov/gene/100313508


Print Friendly, PDF & Email